Digital Letter from the European Residents
in Santa Eulária des Riu
About us
Here is the first photograph of the community of European residents living in the municipality of Santa Eulària des Riu. The statistics have been provided by the INE (National Statistics Institute) and IBESTAT (Balearic Islands Statistics Institute).
We must point out that the figures are never exact (especially on an island like Ibiza, where the sociological movement is permanent) and that we can indicate to both sources of data the clarifications that we consider necessary.
What is certain, in any case, is that these statistics are data which, at least, provide us with an initial basis of knowledge.
1- Foreign Residents in the Balearic Islands
To begin with, let us look at the latest available statistics (IBESTAT) on the foreign population in the Balearic Islands. It is interesting to know the nationalities that we do not always think about:
| Morocco | 28.972 |
| Germany | 18.979 |
| Italy | 22.099 |
| United Kingdom | 19.569 |
| Romania | 11.565 |
| Bulgaria | 5.569 |
| Argentina | 8.511 |
| France | 6.901 |
| China | 5.733 |
| Ecuador | 5.112 |
| Senegal | 5.014 |
2- Foreign Residents in Santa Eulària des Riu
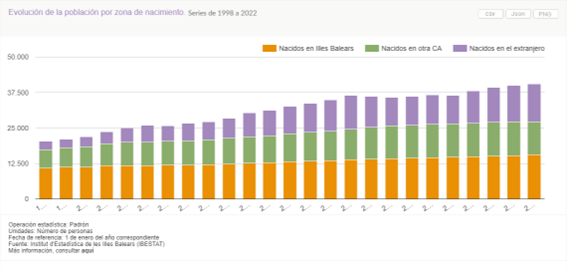
The revision of the figures at the end of 2022 (IBESTAT) indicates a total of 40,038 inhabitants of which 20,177 are men and 19,861 are women. If from this total population we examine the data relating to the evolution of the number of foreign-born residents, we can conclude the table below:

In relation to the place of birth of the inhabitants of Santa Eulària des Riu, an interesting criterion to appreciate the respective socio-cultural origins, the latest figures available, from 2022, indicate the following:
27,267 inhabitants are natives of the Peninsula and the Canary Islands,
38,774 inhabitants are natives of foreign countries,
9.703 native inhabitants from other municipalities of the Pitiusas Islands,
5.415 native inhabitants of Santa Eulària des Riu,
00,410 native inhabitants from Mallorca or Menorca.
To conclude, in order to appreciate the share of European residents among the foreign population living in Santa Eulària des Riu, we should refer to the statistics below, corresponding to the year 2022, which represent a sociological sample of 7,121 people and reveal the respective weight of the main nationalities.
| Italy |
1.302 |
| Germany | 1.140 |
| United Kingdom | 1.625 |
| Romania | 982 |
| Morocco | 739 |
| France | 710 |
| The Netherlands | 564 |
| Argentina | 1.318 |
| Paraguay – Uruguay | 615 |
| Asia | 399 |
| Ecuador | 418 |
These figures are provisional on the part of the official statistical bodies, at central level and at the level of the autonomous community of the Balearic Islands. In addition to the natural sociological movements observed between 2022, main residents and European residents in Santa Eulària de los Riu, the figures indicate the following data:
| Italy | 1.901 |
| Romania | 1.126 |
| United Kingdom | 1.717 |
| Germany | 1.203 |
| France | 754 |
| The Netherlands | 595 |
Balearic Islands / importance of migratory flow / data 2021
| Period | Datum | |
| Migration balance | 2021 | 5.833 |
| Total number of immigrations | 2021 | 72.432 |
| Total number of emigrations | 2021 | 66.599 |
Comment:
Out of a total of 1.173 million inhabitants, the annual migratory flow is 139,031 people, 11.8%.
Population data 2022/ Total Santa Eulària des Riu
| Men | Women | |
| 2021 | 2021 | |
| Santa Eulària del Riu | ||
| Spanish | 14.215 | 14.170 |
| Foreign | 5.929 | 5.924 |
Population 2022 Santa Eulària des Riu according to place of birth
| Men | Women | |
| 2021 | 2021 | |
| Santa Eulària del Riu | ||
| Nacidos en Illes Balears | 7.770 | 7.758 |
| Nacidos en otra CA | 6.109 | 5.630 |
| Nacidos en el extranjero | 6.575 | 6.706 |
Foreign population 2022 / Santa Eulària des Riu by nationality.
| Germany | 1203 |
| France | 0754 |
| Italy | 1901 |
| The Netherlands | 595 |
| Portugal | 134 |
| United Kingdom | 1717 |
| Rest UE 15 | 5061 |
| Poland | 104 |
| Rest UE 25 | 251 |
| Bulgaria | 123 |
| Romania | 1126 |
| Rest of Europe | 2135 |
| Ukraine | 167 |
| Russia | 48 |
| Morocco | 711 |
| Nigeria | 3 |
| Senegal | 47 |
| Rest of Africa | 114 |
| North America | 140 |
| Cuba | 40 |
| Dominican Republic | 26 |
| Rest of Central America | 26 |
| Argentina | 404 |
| Bolivia | 31 |
| Brazil | 167 |
| Colombia | 253 |
| Chile | 68 |
| Ecuador | 188 |
| Paraguay | 305 |
| Uruguay | 121 |
| Rest of South America | 0 |
| China | 79 |
| Philippines | 187 |
| India | 28 |
| Rest of Asia | 60 |
| Oceania | 21 |


